Profit booking from long-term equity investments – does it work?
Background:
I had written my first financial blog post on the journey of a 17-year old SIP in Franklin India Prima Fund. The link to this post is included below.
https://w2dwealthmanagers.blogspot.com/2020/04/my-sips-17-year-journey-in-franklin.html
Many readers commented that it is not wise to stay invested and that one should periodically book profits when the markets were overvalued, or say, when the investment had doubled in value.
These comments made me think – should I look at booking profits from my equity investments periodically, even if I do not need the money in the next 10 – 15 years?
I therefore decided to do a statistical experiment on another long-standing investment that I had made in the year 2003 and 2004 and see if booking profits in those investments worked!
The Investment:
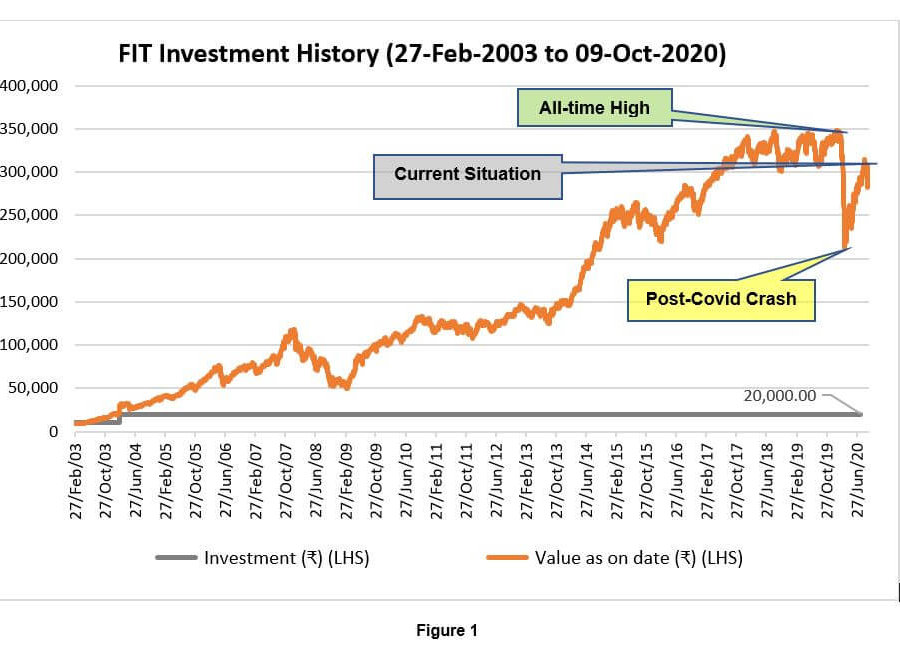
I invested a lumpsum amount of ₹ 10,000/- on 27-Feb-03 and ₹ 10,000/- on 23-Feb-04 in Franklin India Taxshield (FIT) for my tax savings investments for FY 2002-03 and 2003-04 respectively. My subsequent investments were done through the SIP route in a separate folio, and hence data on this lumpsum investment of ₹ 20,000/- is available to me to do the analysis in this article.
While I am an investor in actively managed Equity funds, once I invest in them, I tend to become a Passive Investor, and try to stick with the same Fund / Fund House for long instead of actively trying to guess the next best performer. Hence, I have continued to be an investor in FIT for close to 17.50 years now.
The Exercise:
I tested this investment of ₹ 20,000/- for the following three situations: The first is the actual scenario, wherein I did not disturb the investment, whereas the other two are hypothetical situations of profit booking:
- The actual situation of having continued the investments without disturbing them,
- Profit booking every time I had an absolute 100% gain on the investment – i.e. the investment value doubling to ₹ 40,000/- and ₹ 20,000/- was removed from FIT and invested in a debt fund (PB – 100%),
- Profit booking every time I had an absolute 50% gain on the investment – i.e. the investment value going upto ₹ 30,000/-, where ₹ 10,000/- was removed from FIT and invested in the debt fund (PB – 50%).
For profit booking, it is assumed that the amount that was moved out from FIT was invested in Franklin India Corporate Debt Fund (FICDF), a Debt Fund which has a reasonably good track record since its launch. In both the cases, while the profit was taken out and invested in FICDF, the original amount was kept in the fund.
The following figure 1 shows the journey of this investment in FIT – Regular Plan – Growth Option from 27-Feb-2003 to 9-Oct-2020:
Figure 1
The profit booking results:
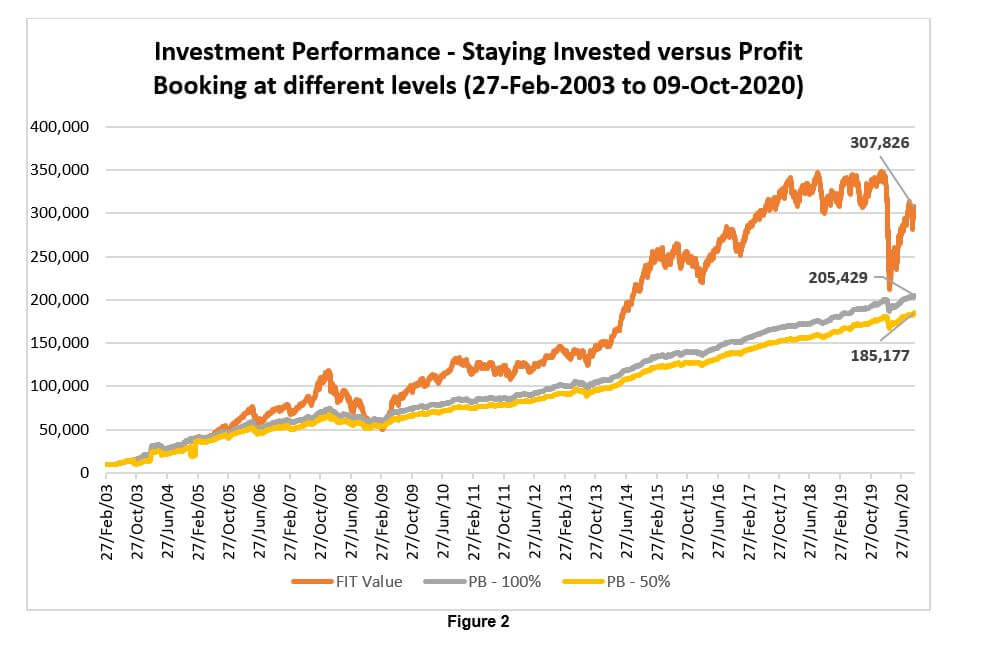
With this background, let me present the findings for the profit booking exercise, which is first represented graphically in figure 2.
Figure 2
Let us now look at performance tables for different dates for all these three strategies:
| Particulars | On 17-Jan-2020 (All Time high NAV of Fund) | ||
| 100% invested | PB – 100% | PB – 50% | |
| Original Amount invested (₹) | 20,000/- | 20,000/- | 20,000/- |
| Value as on date (₹) | 348,488/- | 197,141/- | 178,437/- |
| Return (XIRR) % p.a. | 19.00% | 14.95% | 14.26% |
| Difference over 100% invested strategy | – | (151,347/-) | (170,051/-) |
| % Difference over 100% invested strategy | N.A. | -43.43% | -48.00% |
Table 1(a): Performance Data for the three strategies as on 17-Jan-20, the day when the Fund hit its all-time High NAV
| Particulars | On 23-Mar-2020 (post-Covid crash) | ||
| 100% invested | PB – 100% | PB – 50% | |
| Original Amount invested (₹) | 20,000/- | 20,000/- | 20,000/- |
| Value as on date (₹) | 212,246/- | 186,882/- | 167,525/- |
| Return (XIRR) % p.a. | 15.29% | 14.41% | 13.66% |
| Difference over 100% invested strategy | – | (25,364/-) | (44,721/-) |
| % Difference over 100% invested strategy | N.A. | -11.95% | -21.07% |
Table 1(b): Performance Data for the three strategies as on 23-Mar-20, the day when the equity markets suffered their single-largest 1-day crash in History
| Particulars | On 09-Oct-2020 (Current situation) | ||
| 100% invested | PB – 100% | PB – 50% | |
| Original Amount invested (₹) | 20,000/- | 20,000/- | 20,000/- |
| Value as on date (₹) | 307,826/- | 205,429/- | 185,177/- |
| Return (XIRR) % p.a. | 17.28% | 14.55% | 13.86% |
| Difference over 100% invested strategy | – | (113,843/-) | (132,658/-) |
| % Difference over 100% invested strategy | N.A. | -36.98% | -43.10% |
Table 1(c): Performance Data for the three strategies as on 09-Oct-20 on the latest available NAV
Tables 1(a) through 1(c) shows the performances on a pre-tax basis on different dates for the three strategies. Obviously, when the monies are eventually withdrawn, there will be a tax incidence that the investor will have to bear. Since debt Investments have a higher incidence of taxation than equity, the overall post-tax portfolio returns will be even lesser than the fully invested portfolio.
There is a better way of achieving the profit-booking objective through the Asset Allocation and rebalancing strategy, which I will address in a separate article.
Summing up:
The above example of a buy-and-hold strategy in an equity fund versus profit booking (which is not a part of a strategic asset allocation rebalancing) shows that the buy-and-hold strategy has worked efficiently for me.
The post-COVID-19 fall on 23-Mar-2020 was an extraordinary event where the BSE Sensex crashed from 29,915 on 20-Mar-20 to 25,981 on 23-Mar-20, a fall of 13.15% in one single day, the worst ever single day fall in the history of the Sensex.
Since then, the Sensex has recovered back to 40,409 on 09-Oct-20, which is a 55% gain from the low made on 23-Mar-20. Hence, any performance numbers being viewed either on 23-Mar-20 or even today may have to consider these extra-ordinary circumstances.
Having said that, it is my job to present relevant examples when it comes to asking the question – profit booking from long-term equity investments – Does it work?
It is upto the personal comfort of an investor in terms of what works for him. The Figure 2 aptly shows the roller coaster ride that equity markets deliver (high volatility and commensurate rewards), whereas the profit booking graphs show a less bumpy ride for the investor, albeit with lower rewards. The choice is yours!
The one angle that I have not considered in the above example is of a scenario when the Investor books the profit, but instead of investing the money in a debt fund ends up consuming it for personal use! This is going to give worse results in the profit booking versus “Buy and Hold” strategy in terms of the wealth creation.
Last but not the least, this money will only come handy to you if you are around to use it. Please stay safe in these difficult times, consider COVID19 as a real threat and please take good care of yourself and your loved ones.
Disclaimers:
- This article depicts the journey of the author in one of his personal investments in Franklin India Taxshield (FIT) (an Equity Linked Savings Scheme) over the last 17.5 years.
- This article should not be construed as an Investment recommendation in mutual funds generally or FIT specifically. The article has been written specifically to show the journey in different market cycles and tries to allay the fears of investors who are disturbed or can get disturbed by the volatility seen in equity markets during the COVID-19 scare or who believe that they need to book periodic profits from their equity investments without specific reference to their strategic asset allocation.
- The returns outlined in the article are simply for the sake of discussion and there is no guarantee that they may be achieved in the future.
- Equity markets carry market risks and there is a great chance of losing a substantial part of your capital over a short period of time in these instruments. In case you are not conversant with the equity markets, capital markets or mutual funds, you should seek professional help before investing your hard-earned monies.
- Last but not the least, mutual funds are subject to market risks. Please refer to the offer document carefully before investing.
What I understood from this article is that the longer you are invested in an equity fund rather than frequently transferring or booking profits, your fund value is likely to be higher at the end of your tenure commitment.